Here is your ready-to-go guide.
🎯 What You're Building Today
A fully functional GA4 property connected through Google Tag Manager, tracking page views, button clicks, form submissions, and outbound clicks—with proper consent handling. Then we'll visualise it all in Looker Studio so you can actually use your data.
MODULE 1: Create Your GA4 Property
Time: 5 minutes
Go to analytics.google.com → Click Admin (bottom left gear icon)
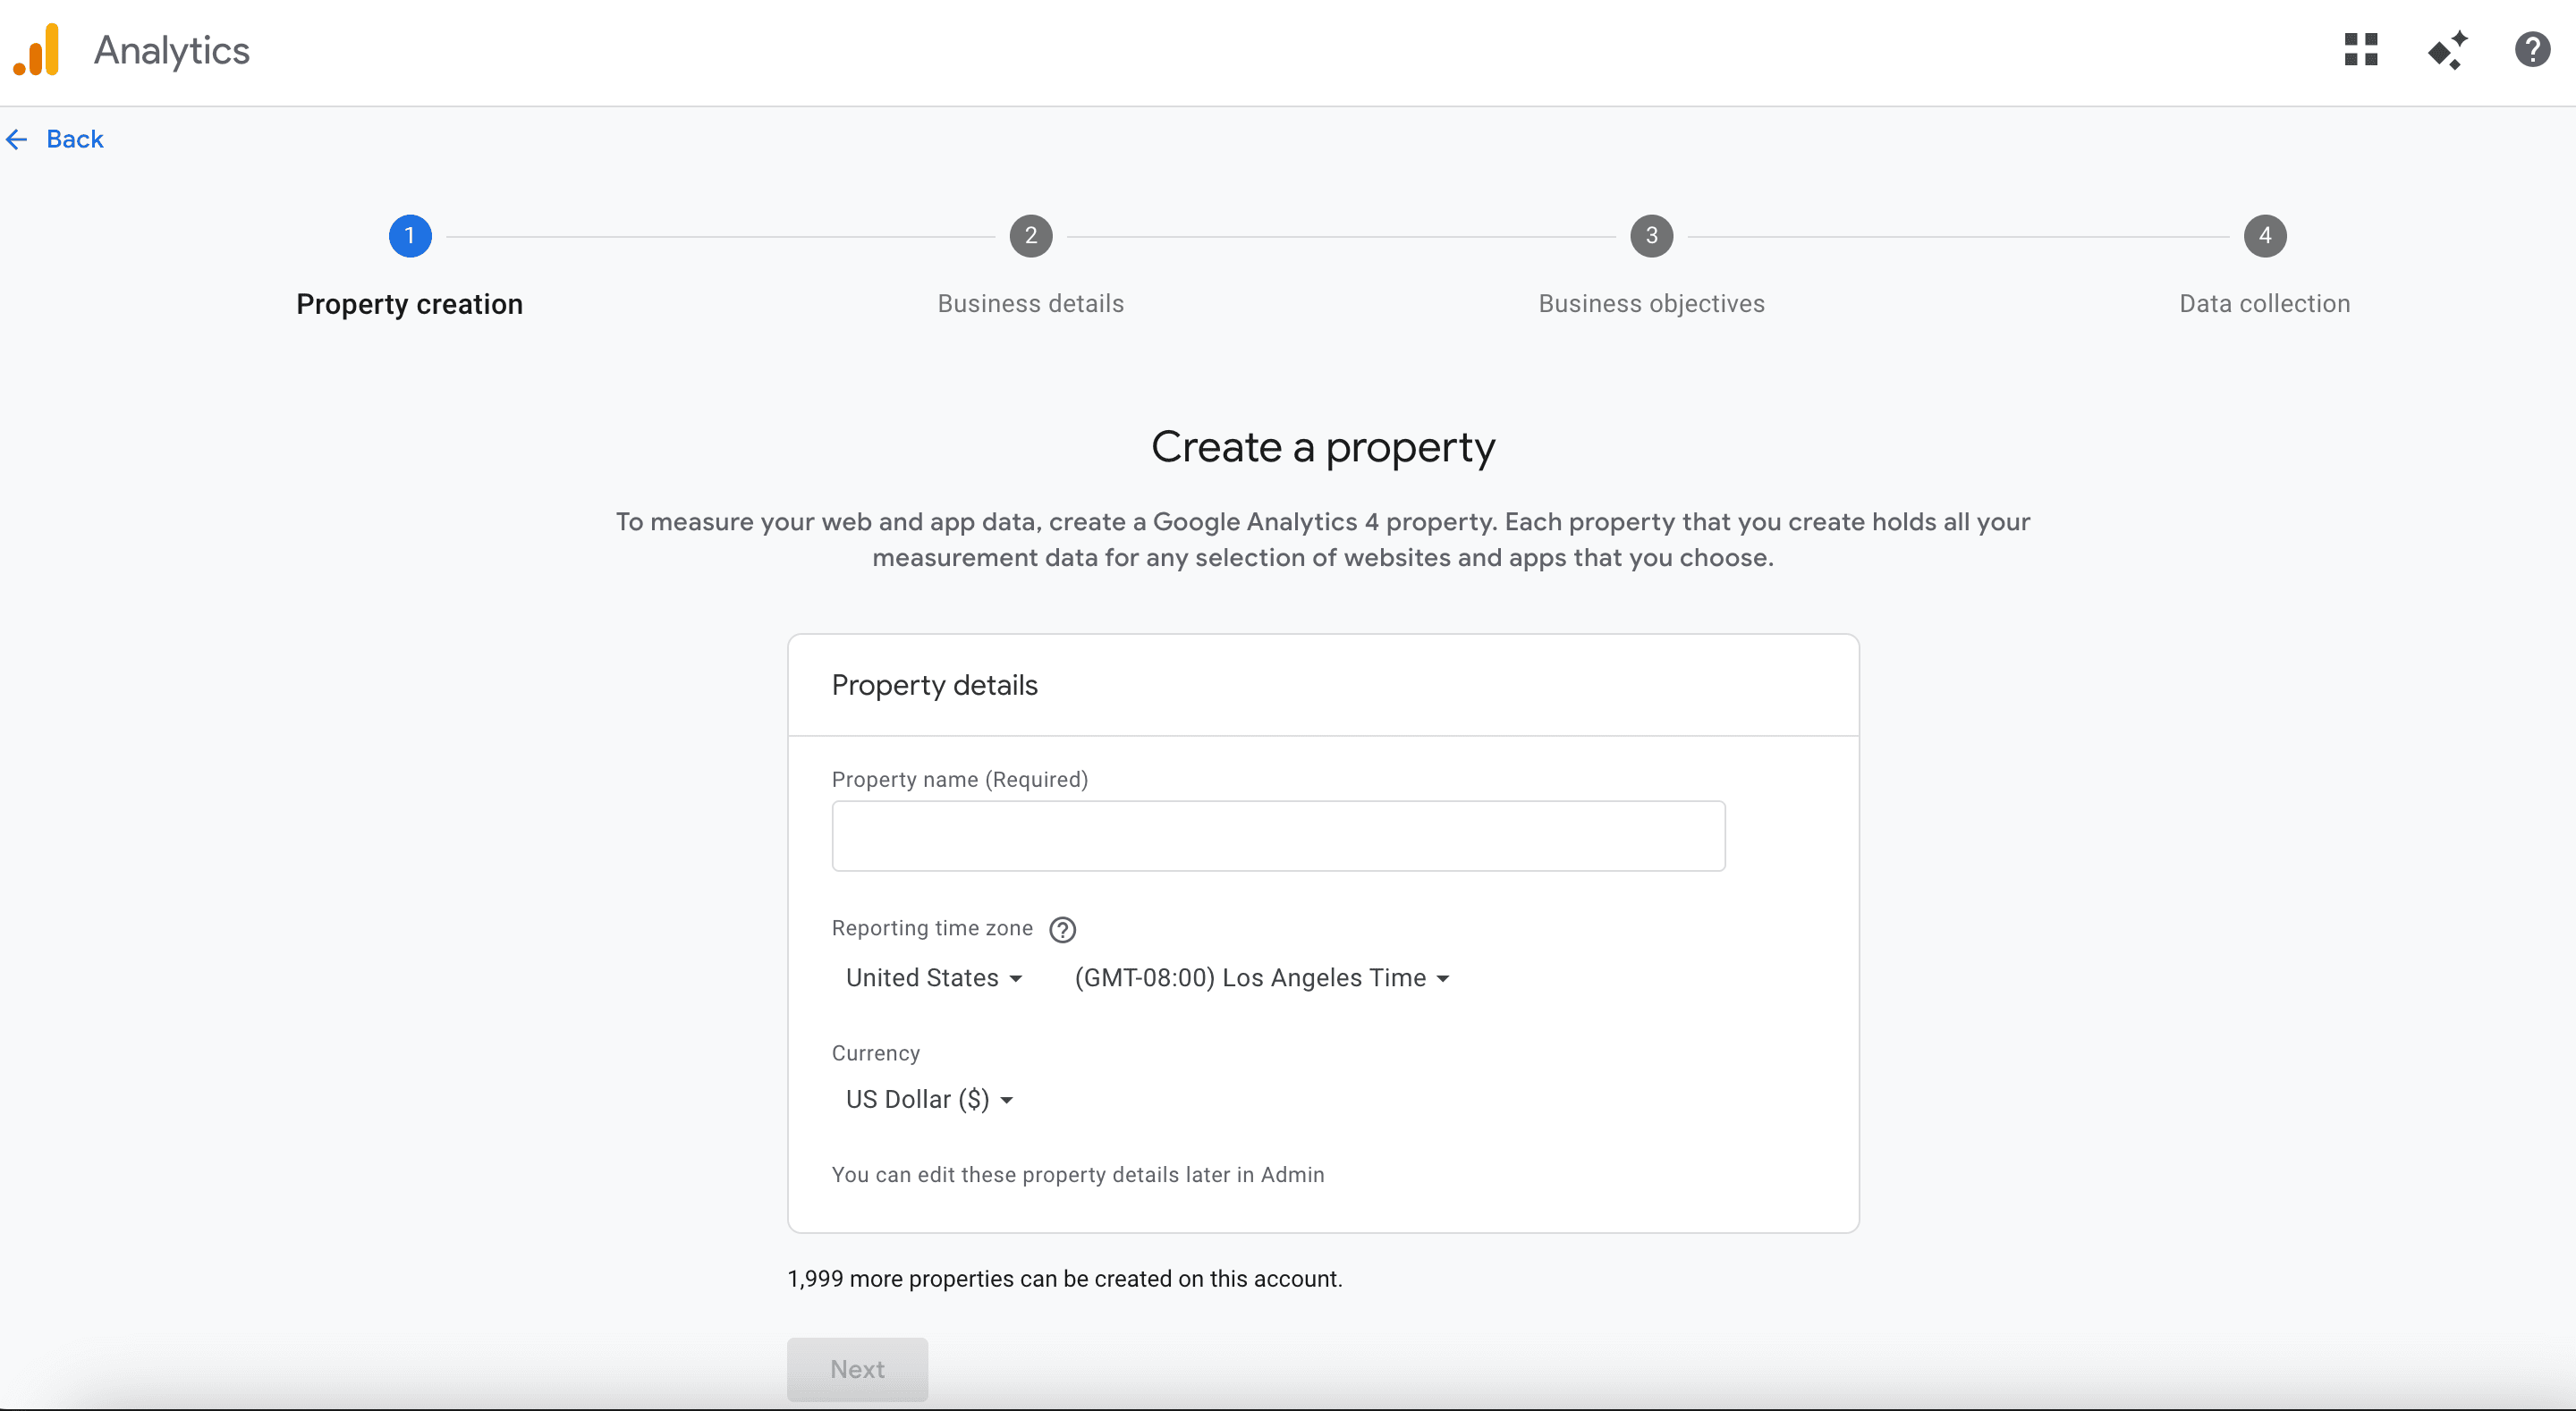
Click + Create Property
Fill in:
Property name (e.g., "Your website name")
Timezone & currency (match your business location)
Click Next → Choose industry & business size → Click Create
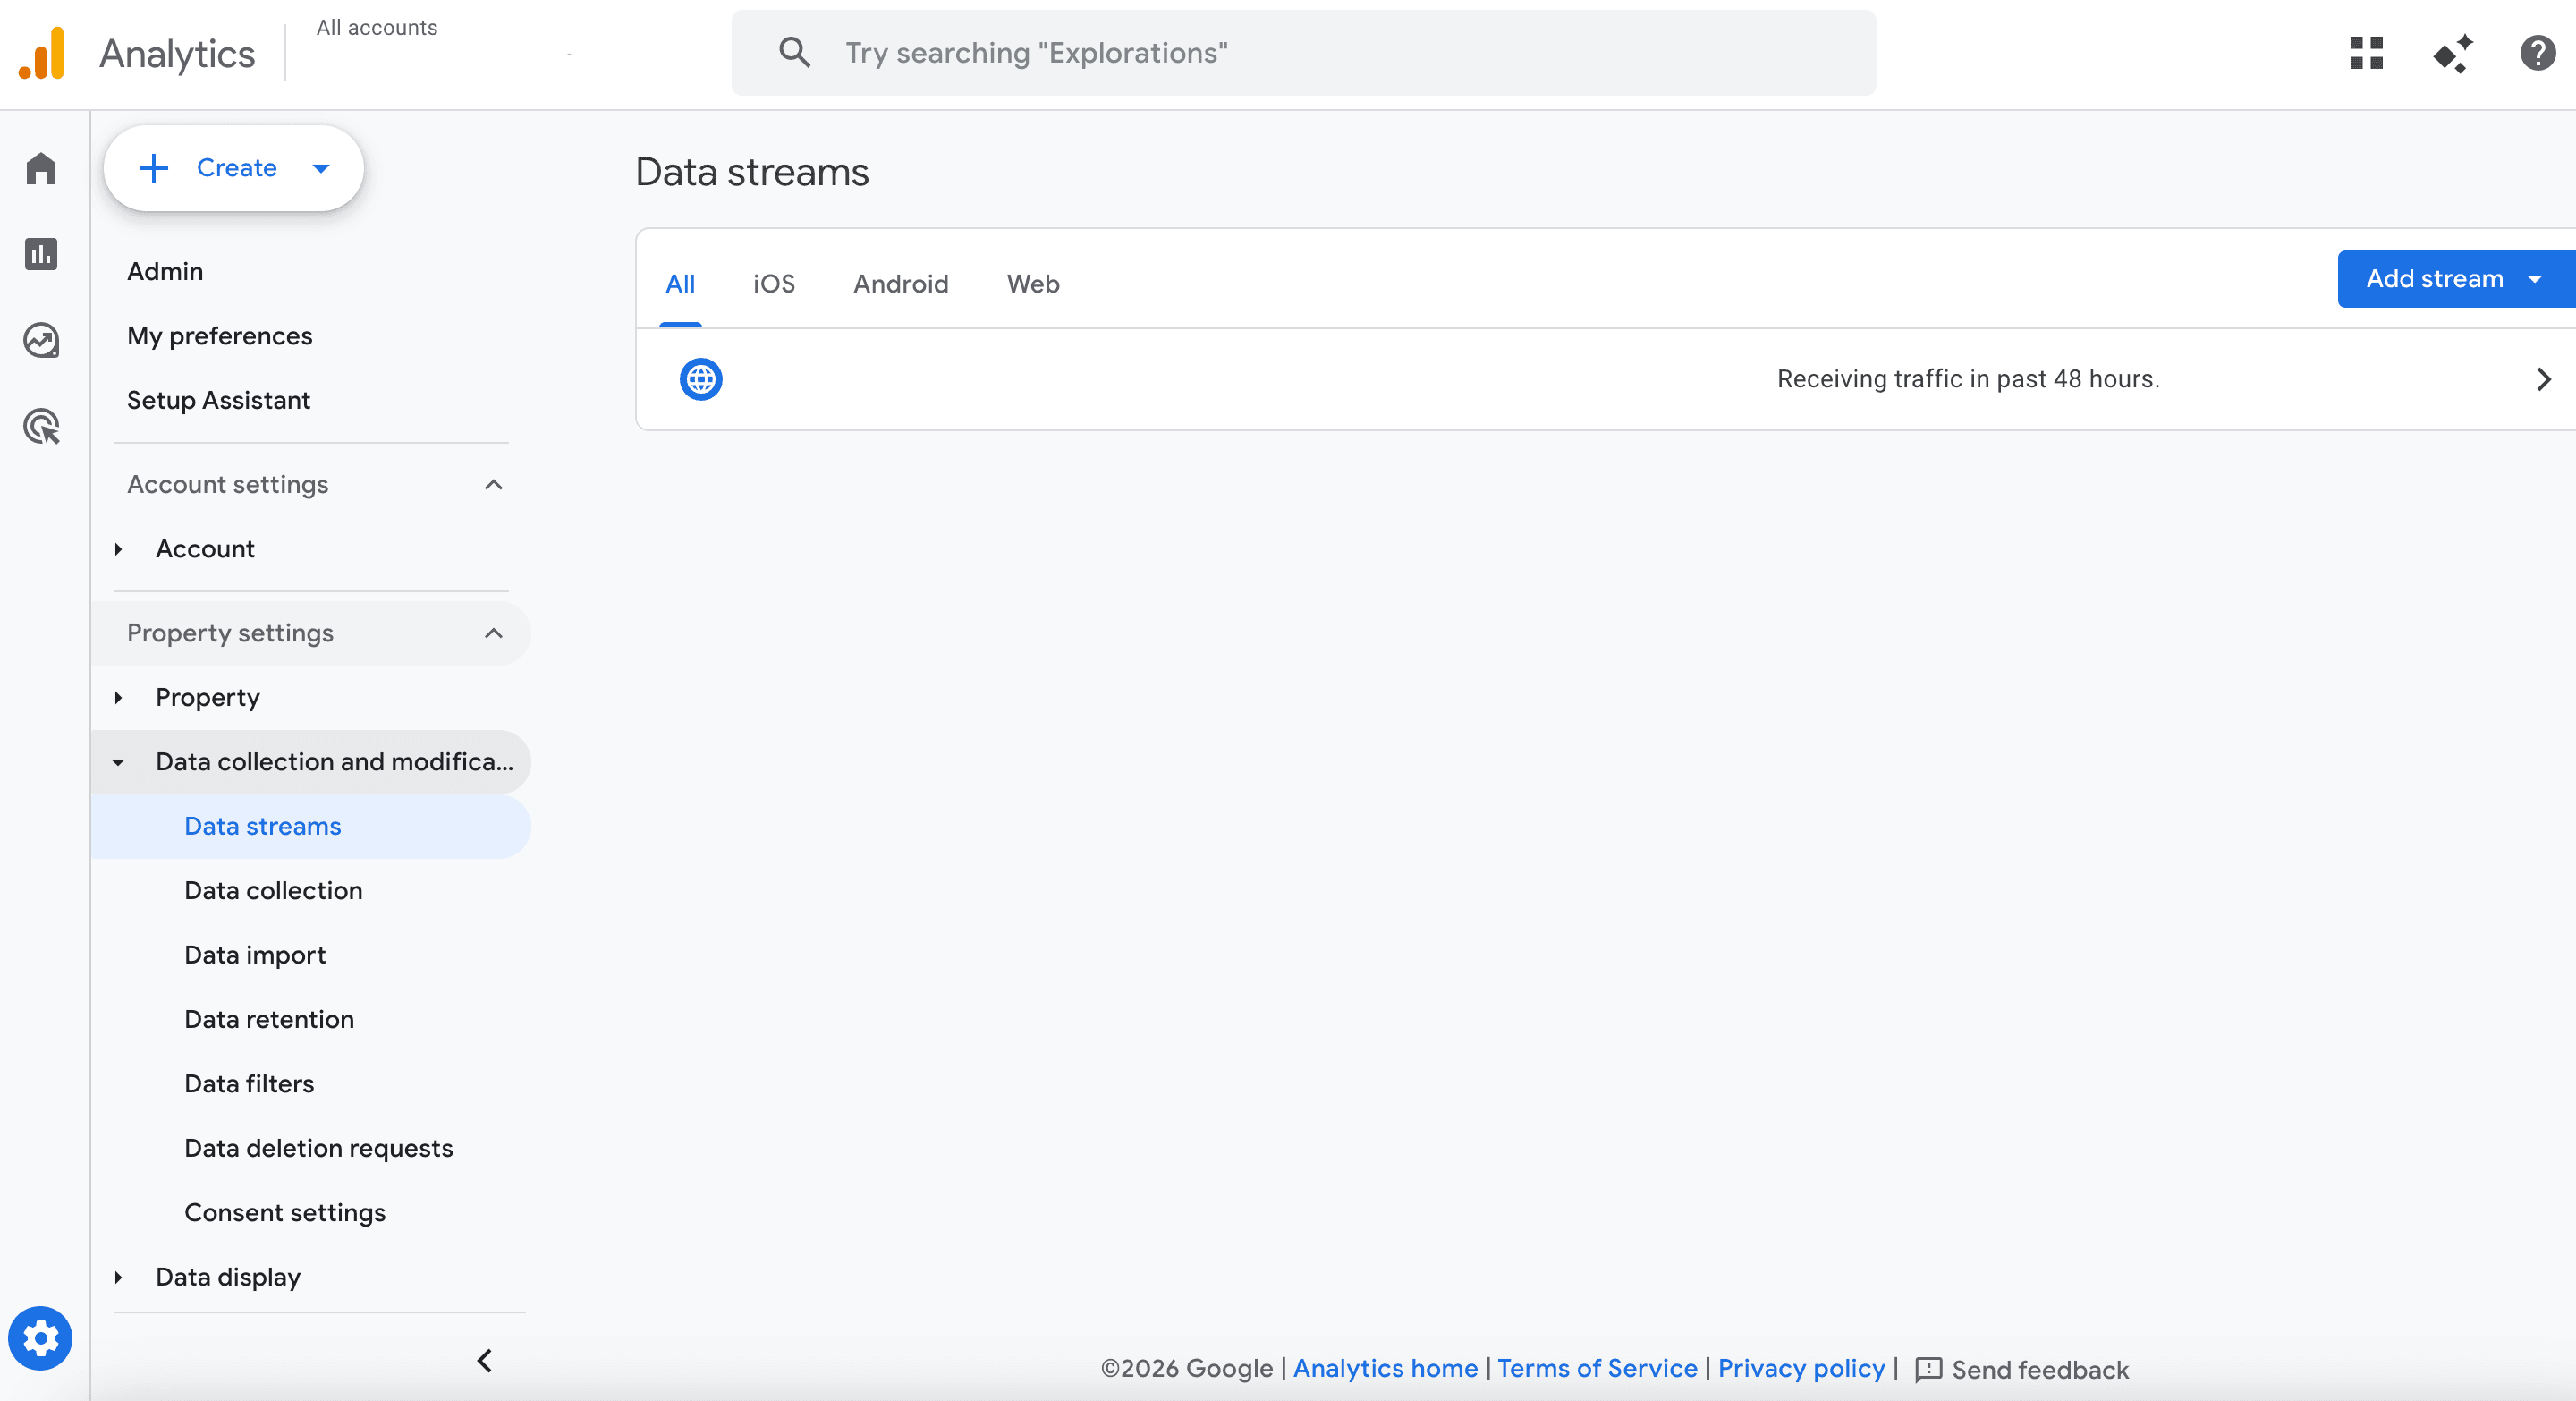
CRITICAL: When asked "Choose a platform," select Web
Enter your website URL → Name the data stream (e.g., "Main Website")
Click Create Stream
Checkpoint: You should see a Measurement ID that looks like G-XXXXXXXXXX. Copy this. You'll need it in 2 minutes.
MODULE 2: Set Up Google Tag Manager
Time: 4 minutes
Go to tagmanager.google.com → Click Create Account
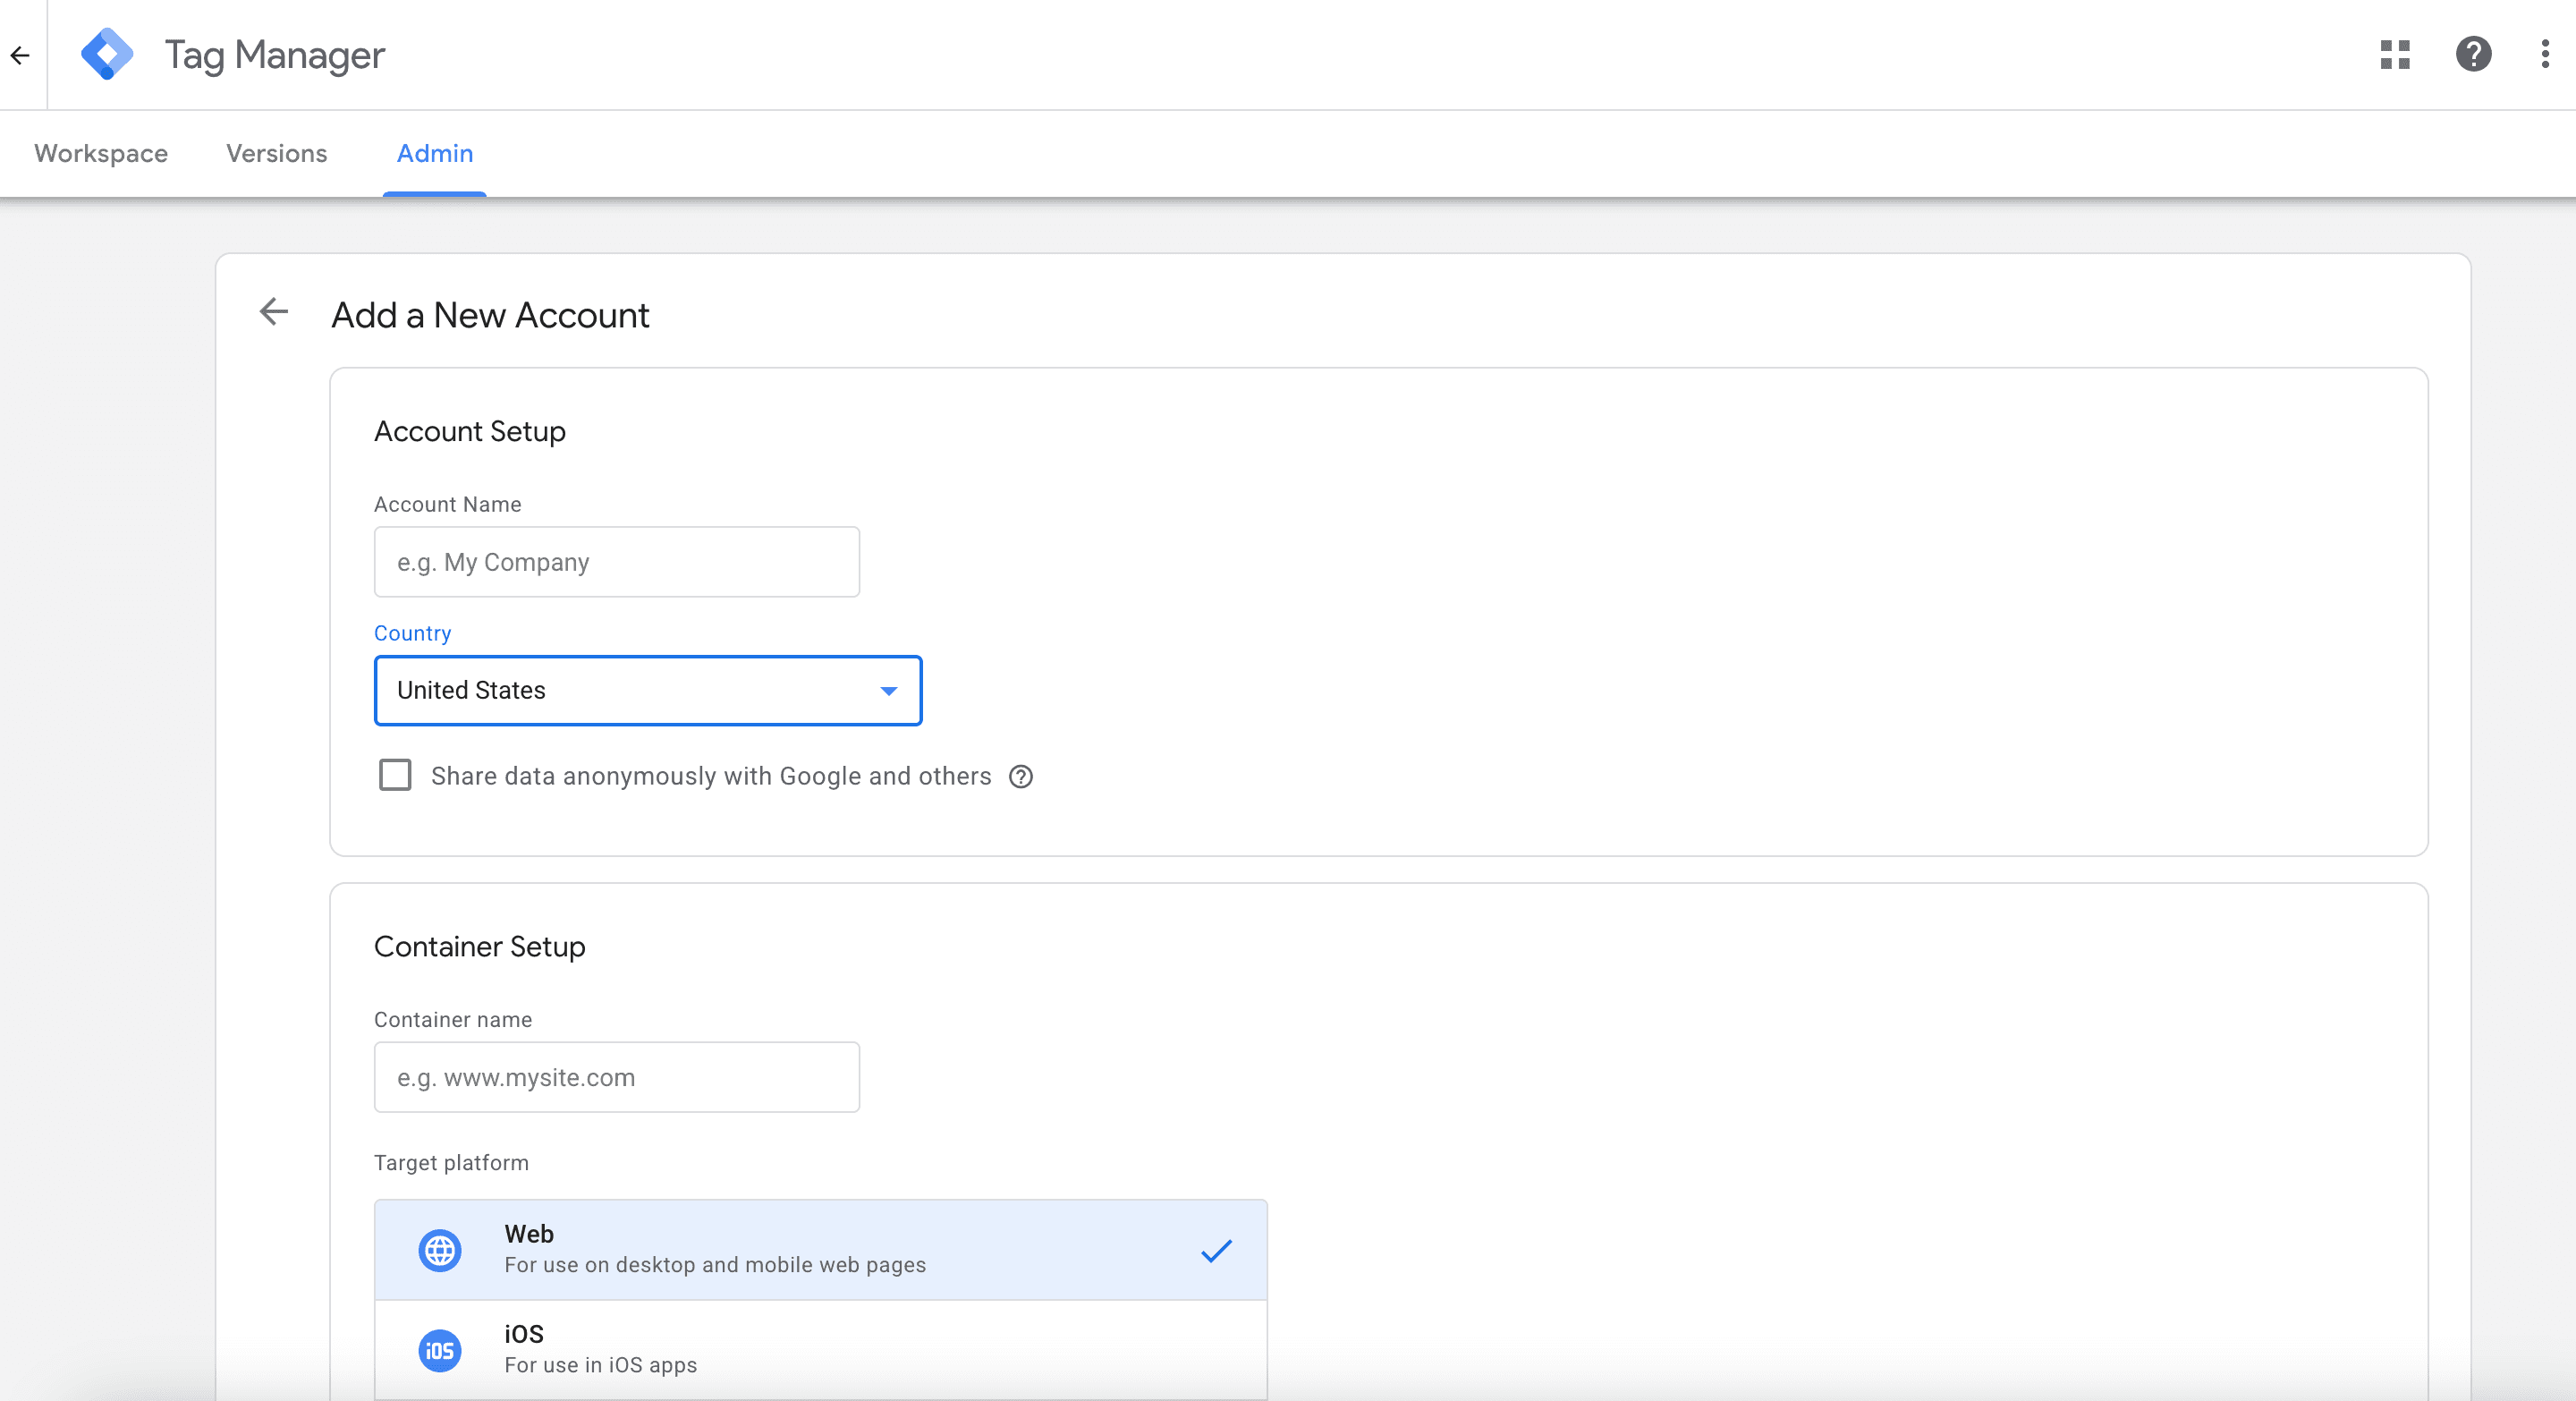
Fill in:
Account Name (your company name)
Country
Container Name (your website domain, e.g., "www.xxx.com")
Target platform: Web
Click Create → Accept Terms
You'll see an install code snippet in two parts (head and body)
Checkpoint: Don't close this window yet. You need to give these code snippets to your developer OR install them yourself.
Action: Copy both code snippets and install them:
First snippet → Paste in <head> of your website
Second snippet → Paste right after opening <body> tag
If you're on WordPress / Shopify / Wix, search "install Google Tag Manager on [your platform]" for plugin options.
MODULE 3: Connect GA4 to GTM
Time: 5 minutes
In GTM, click Tags (left sidebar) → New
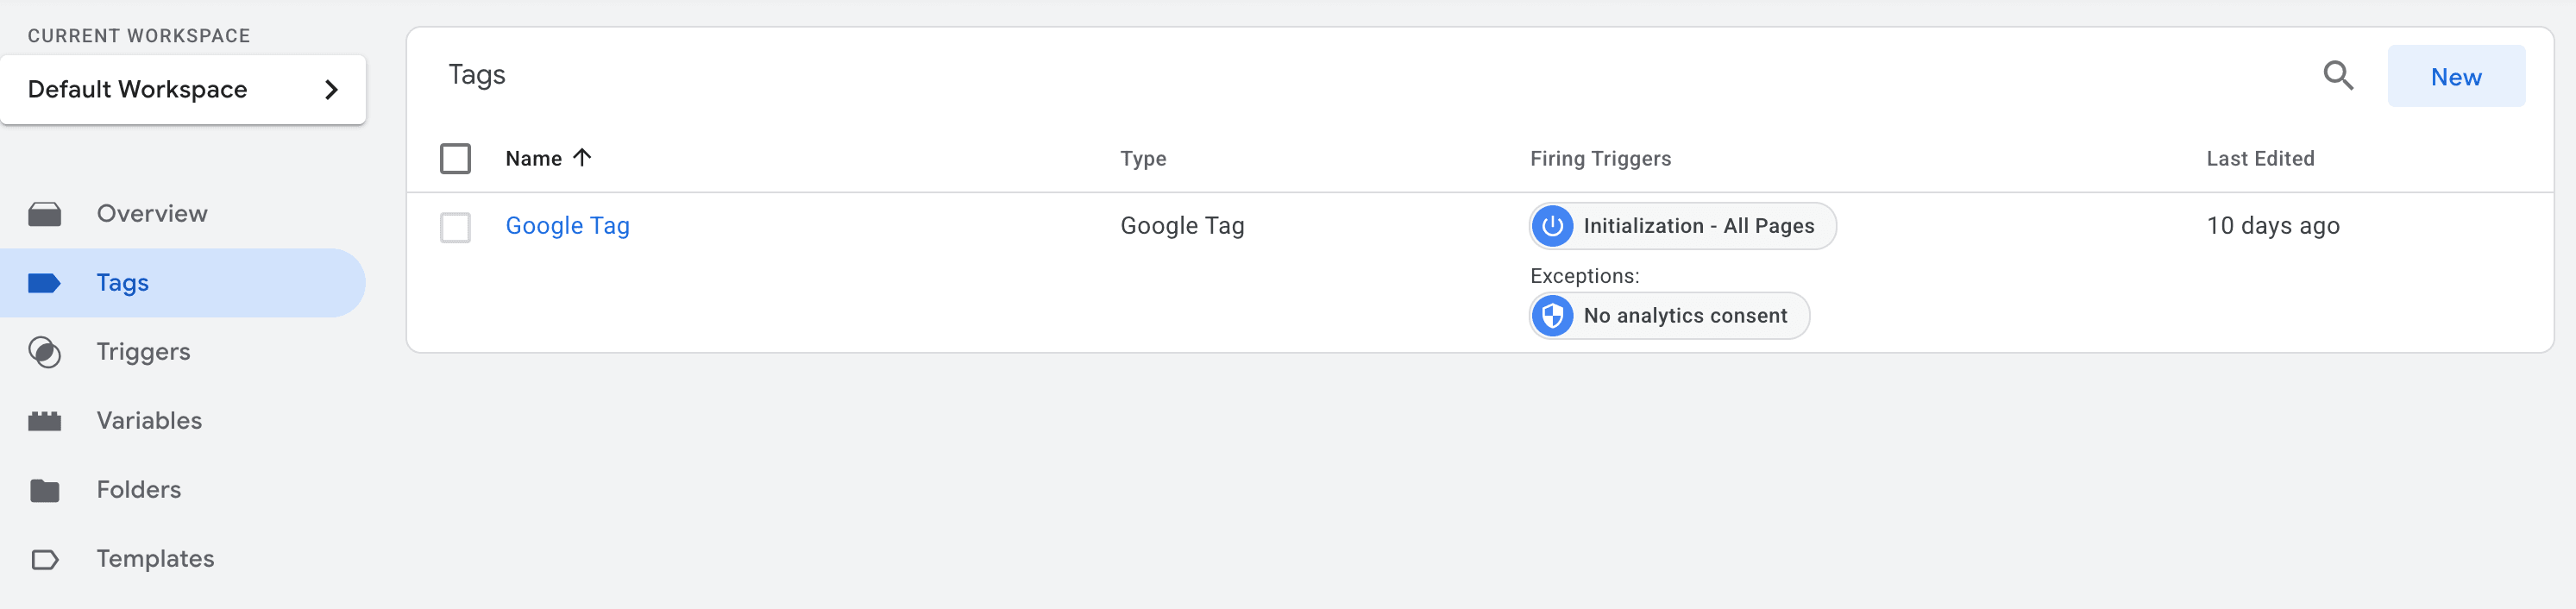
Click the tag configuration box → Choose Google Analytics: GA4 Configuration
Paste your Measurement ID (G-XXXXXXXXXX) from Module 1
Click Triggering → Select All Pages
⚠️ STOP: Understanding Triggers for Your Site Type
What "All Pages" actually means:
Traditional Multi-Page Sites (WordPress, static HTML, server-rendered): The "All Pages" trigger fires on every full page load. Perfect for most sites.
Single Page Applications (React, Vue, Next.js, Angular): The page doesn't fully reload when users navigate—content changes dynamically via JavaScript. The default "All Pages" trigger only fires on the initial load, missing all subsequent "page" changes.
If you have an SPA, do this:
After selecting "All Pages" trigger, click the + icon to add another trigger
Choose History Change (this fires when the URL changes without a full reload)
Your GA4 Config tag should now have two triggers: "All Pages" AND "History Change"
This ensures tracking works on initial load + all navigation events
How to know if you're on an SPA: Navigate your site. If the URL changes but the page doesn't "flash" white during reload, you're on an SPA.
Name your tag: "GA4 - Config"
Click Save
Checkpoint: You should see your new tag in the Tags list with 1 or 2 triggers depending on your site type.
🔒 CONSENT MODE: Why You Need It (And How to Add It Soon)
The Reality: EU (GDPR), UK, California (CCPA), and many other regions require user consent before dropping analytics cookies. GA4 + GTM can respect this through Consent Mode.
What happens without it: You risk fines, user complaints, and data collection issues in regulated markets.
Quick Implementation Path (for later—don't do this now):
Install a Consent Management Platform (CMP) like Cookiebot, OneTrust, or Usercentrics
In GTM, enable Consent Overview (under Admin)
Add consent initialisation code in GTM (your CMP will provide this)
Update your GA4 Config tag to wait for consent before firing
GA4 will collect cookieless "pings" for denied users (aggregated data only)
For this quick guide: I am skipping consent setup to keep you moving. However, flag this with your legal / compliance team within the next 30 days if you're in a regulated market. Or reach me out for support via https://www.ilya-semenov.com/contact or https://www.linkedin.com/in/ilya-semenov-al/
MODULE 4: Test Before You Publish
Time: 3 minutes
Never publish blind. Always preview.
Click Preview (top right in GTM)
Enter your website URL → Click Connect
A new window opens showing your site + a GTM debugger panel
Look for your "GA4 - Config" tag → It should show "Tag Fired" in green
SPA users: Navigate to another page on your site. The tag should fire again via the History Change trigger.
Open a new tab → Go to GA4 → Click Reports → Realtime
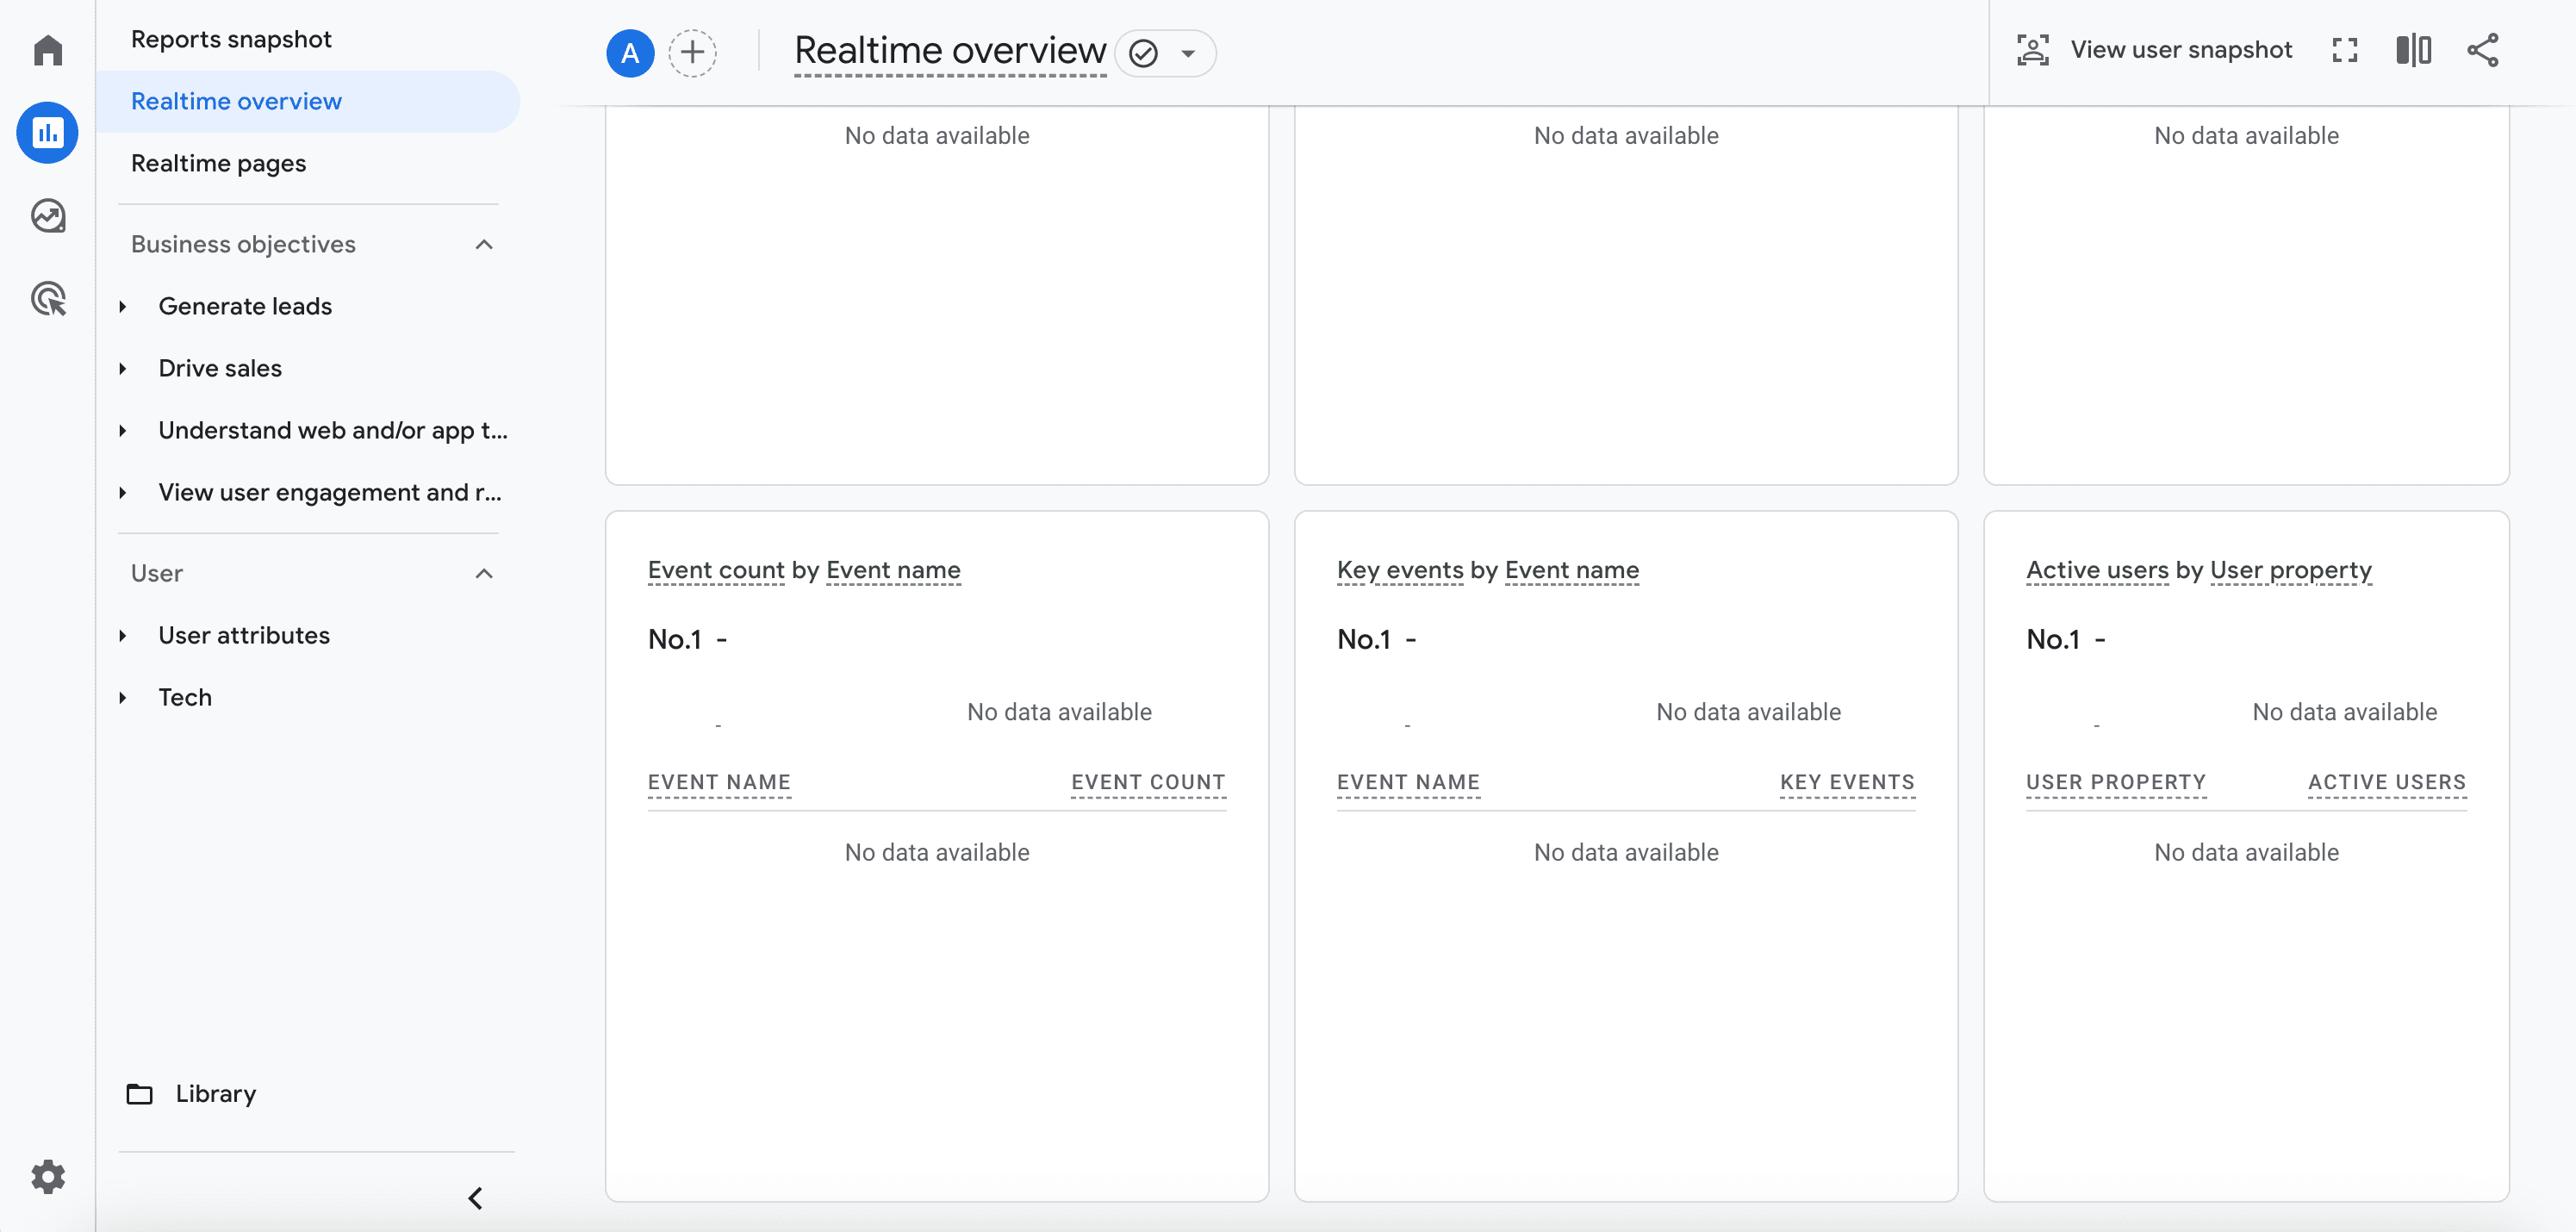
You should see yourself as 1 active user right now
Checkpoint: If you see yourself in GA4 Realtime, you're golden. If not, check that your GTM codes are installed correctly on your site.
MODULE 5: Publish Your Container
Time: 1 minute
Close the preview window
In GTM, click Submit (top right)
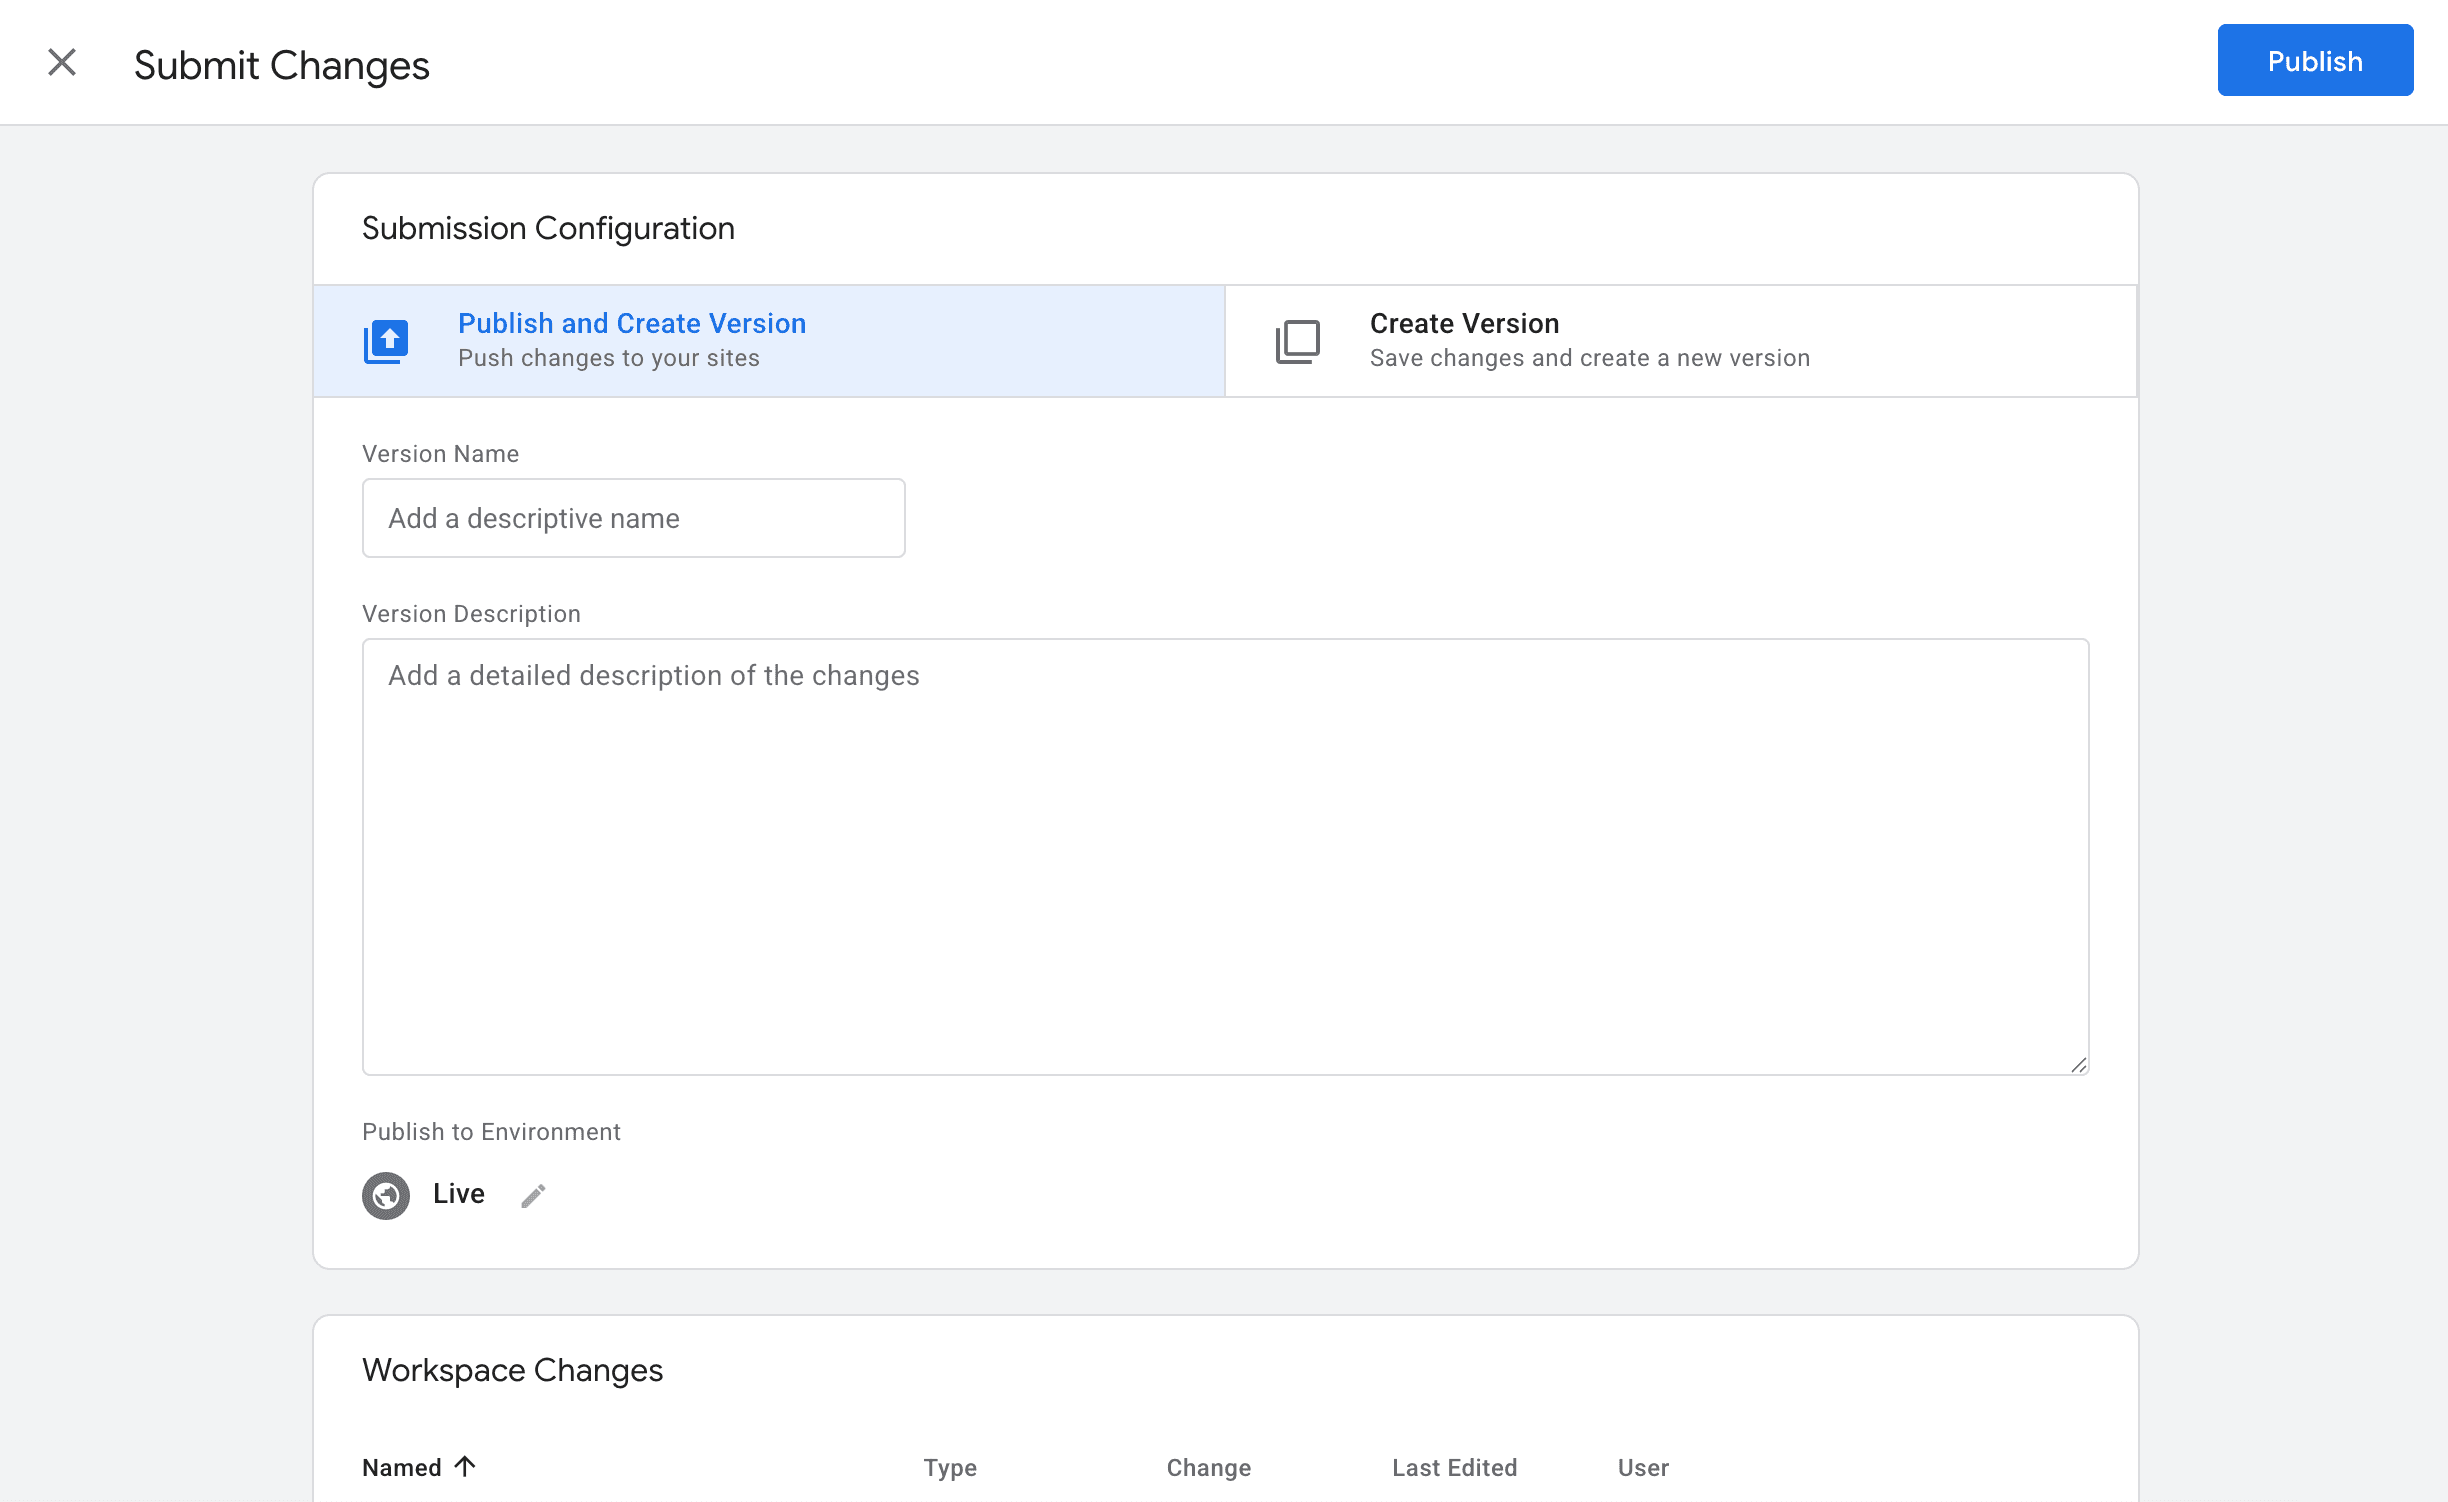
Add a Version Name: "Initial GA4 Setup"
Add Description: "GA4 config tag + page view triggers"
Click Publish
Checkpoint: Your GA4 is now live and collecting data 24/7.
MODULE 6: Set Up Essential Events
Time: 15 minutes
GA4 is running, but you want richer data. Let's add button clicks, form submissions, and outbound link tracking.
🎯 The Right Way vs. The Quick Way
IMPORTANT: Data Layer is the Gold Standard
If you have developers or a tech team, always ask them to implement events via the Data Layer. Here's why:
Data Layer approach (recommended):
Developers push structured event data directly to GTM's dataLayer object
Clean, reliable, doesn't break when HTML / CSS changes
Captures data that's not visible in the DOM (user IDs, product SKUs, backend states)
Example: dataLayer.push({'event': 'button_click', 'button_name': 'signup', 'button_location': 'header'})
Why it's better: Your tracking survives site redesigns, A/B tests, and CSS framework changes. Developers control exactly what gets tracked.
When to use the Data Layer:
Medium to large websites
E-commerce sites
Sites with dev resources
Long-term tracking implementations
When you need precision and stability
The Scraping Approach (what I am showing below):
This is a temporary or small-site solution that works by "scraping" HTML elements—detecting clicks, reading CSS selectors, grabbing text content. It's fast to set up but fragile.
When to use scraping (approach below):
Small websites or landing pages
No developer access
Testing / proof-of-concept phase
Temporary tracking until proper implementation
Personal projects or side hustles
The trade-off: If your designer changes a button class from .btn to .button-primary, your tracking breaks until you update GTM.
Approach for this guide:
I am showing the scraping method because it works immediately without code changes. But if you have developers, show them this guide on Data Layer implementation after you finish: search "Google Tag Manager Data Layer tutorial" or share the GTM developer docs.
Pro tip: Use scraping to get tracking running today, then migrate to Data Layer over the next sprint with your dev team.
Event 1: Button Click Tracking (Scraping Method)
Why this matters: Buttons drive conversions—you need to know which ones actually get clicked.
In GTM, click Variables → Configure (under Built-In Variables)
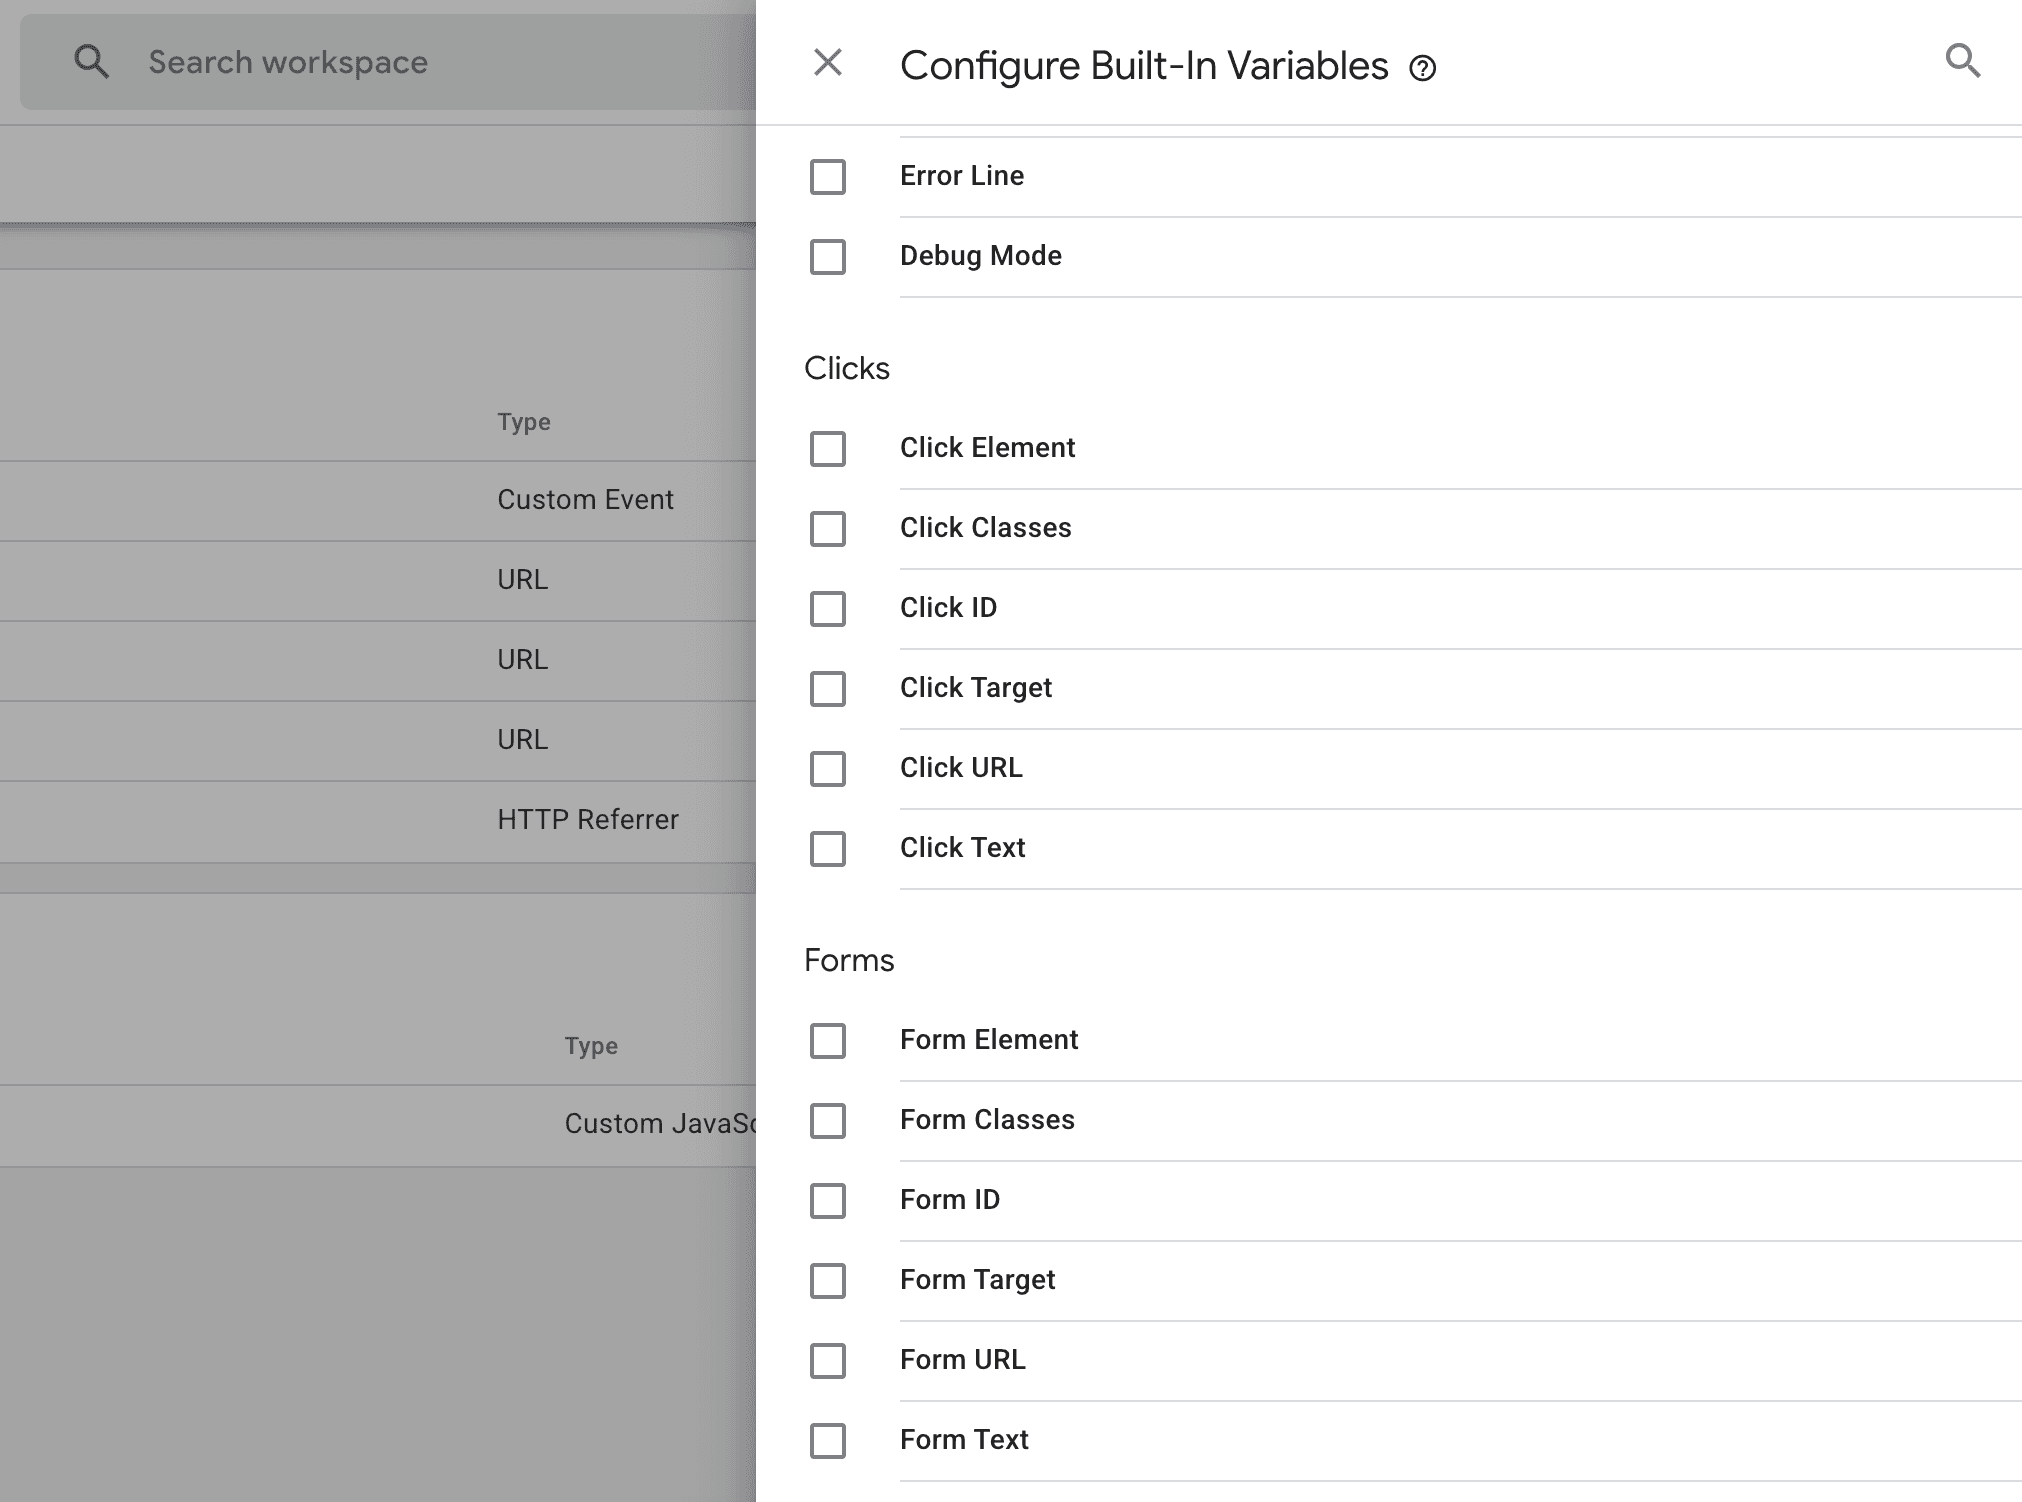
Scroll to Clicks section → Check these boxes:
Click Element
Click Classes
Click ID
Click Text
Click URL
Click Triggers → New
Choose Click - All Elements
Set "This trigger fires on: Some Clicks"
Add condition:
Click Element → matches CSS selector → button, .btn, .cta, a.button, input[type="submit"]
(This catches most button patterns—adjust based on your site's HTML)
Name it: "Click - All Buttons"
Click Save
Go to Tags → New
Choose Google Analytics: GA4 Event
Paste your Measurement ID: G-XXXXXXXXXX
Event Name: button_click
Add Event Parameters:
Parameter Name: button_text → Value: {{Click Text}}
Parameter Name: button_id → Value: {{Click ID}}
Parameter Name: button_classes → Value: {{Click Classes}}
Triggering: Select "Click - All Buttons"
Name: "GA4 - Button Clicks"
Click Save
Checkpoint: Preview. Click any button on your site. Check if "button_click" fires with the button text captured.
Event 2: Form Submission Tracking (Scraping Method)
Why this matters: Form submits are micro-conversions—newsletter signups, contact forms, lead gen.
Click Triggers → New
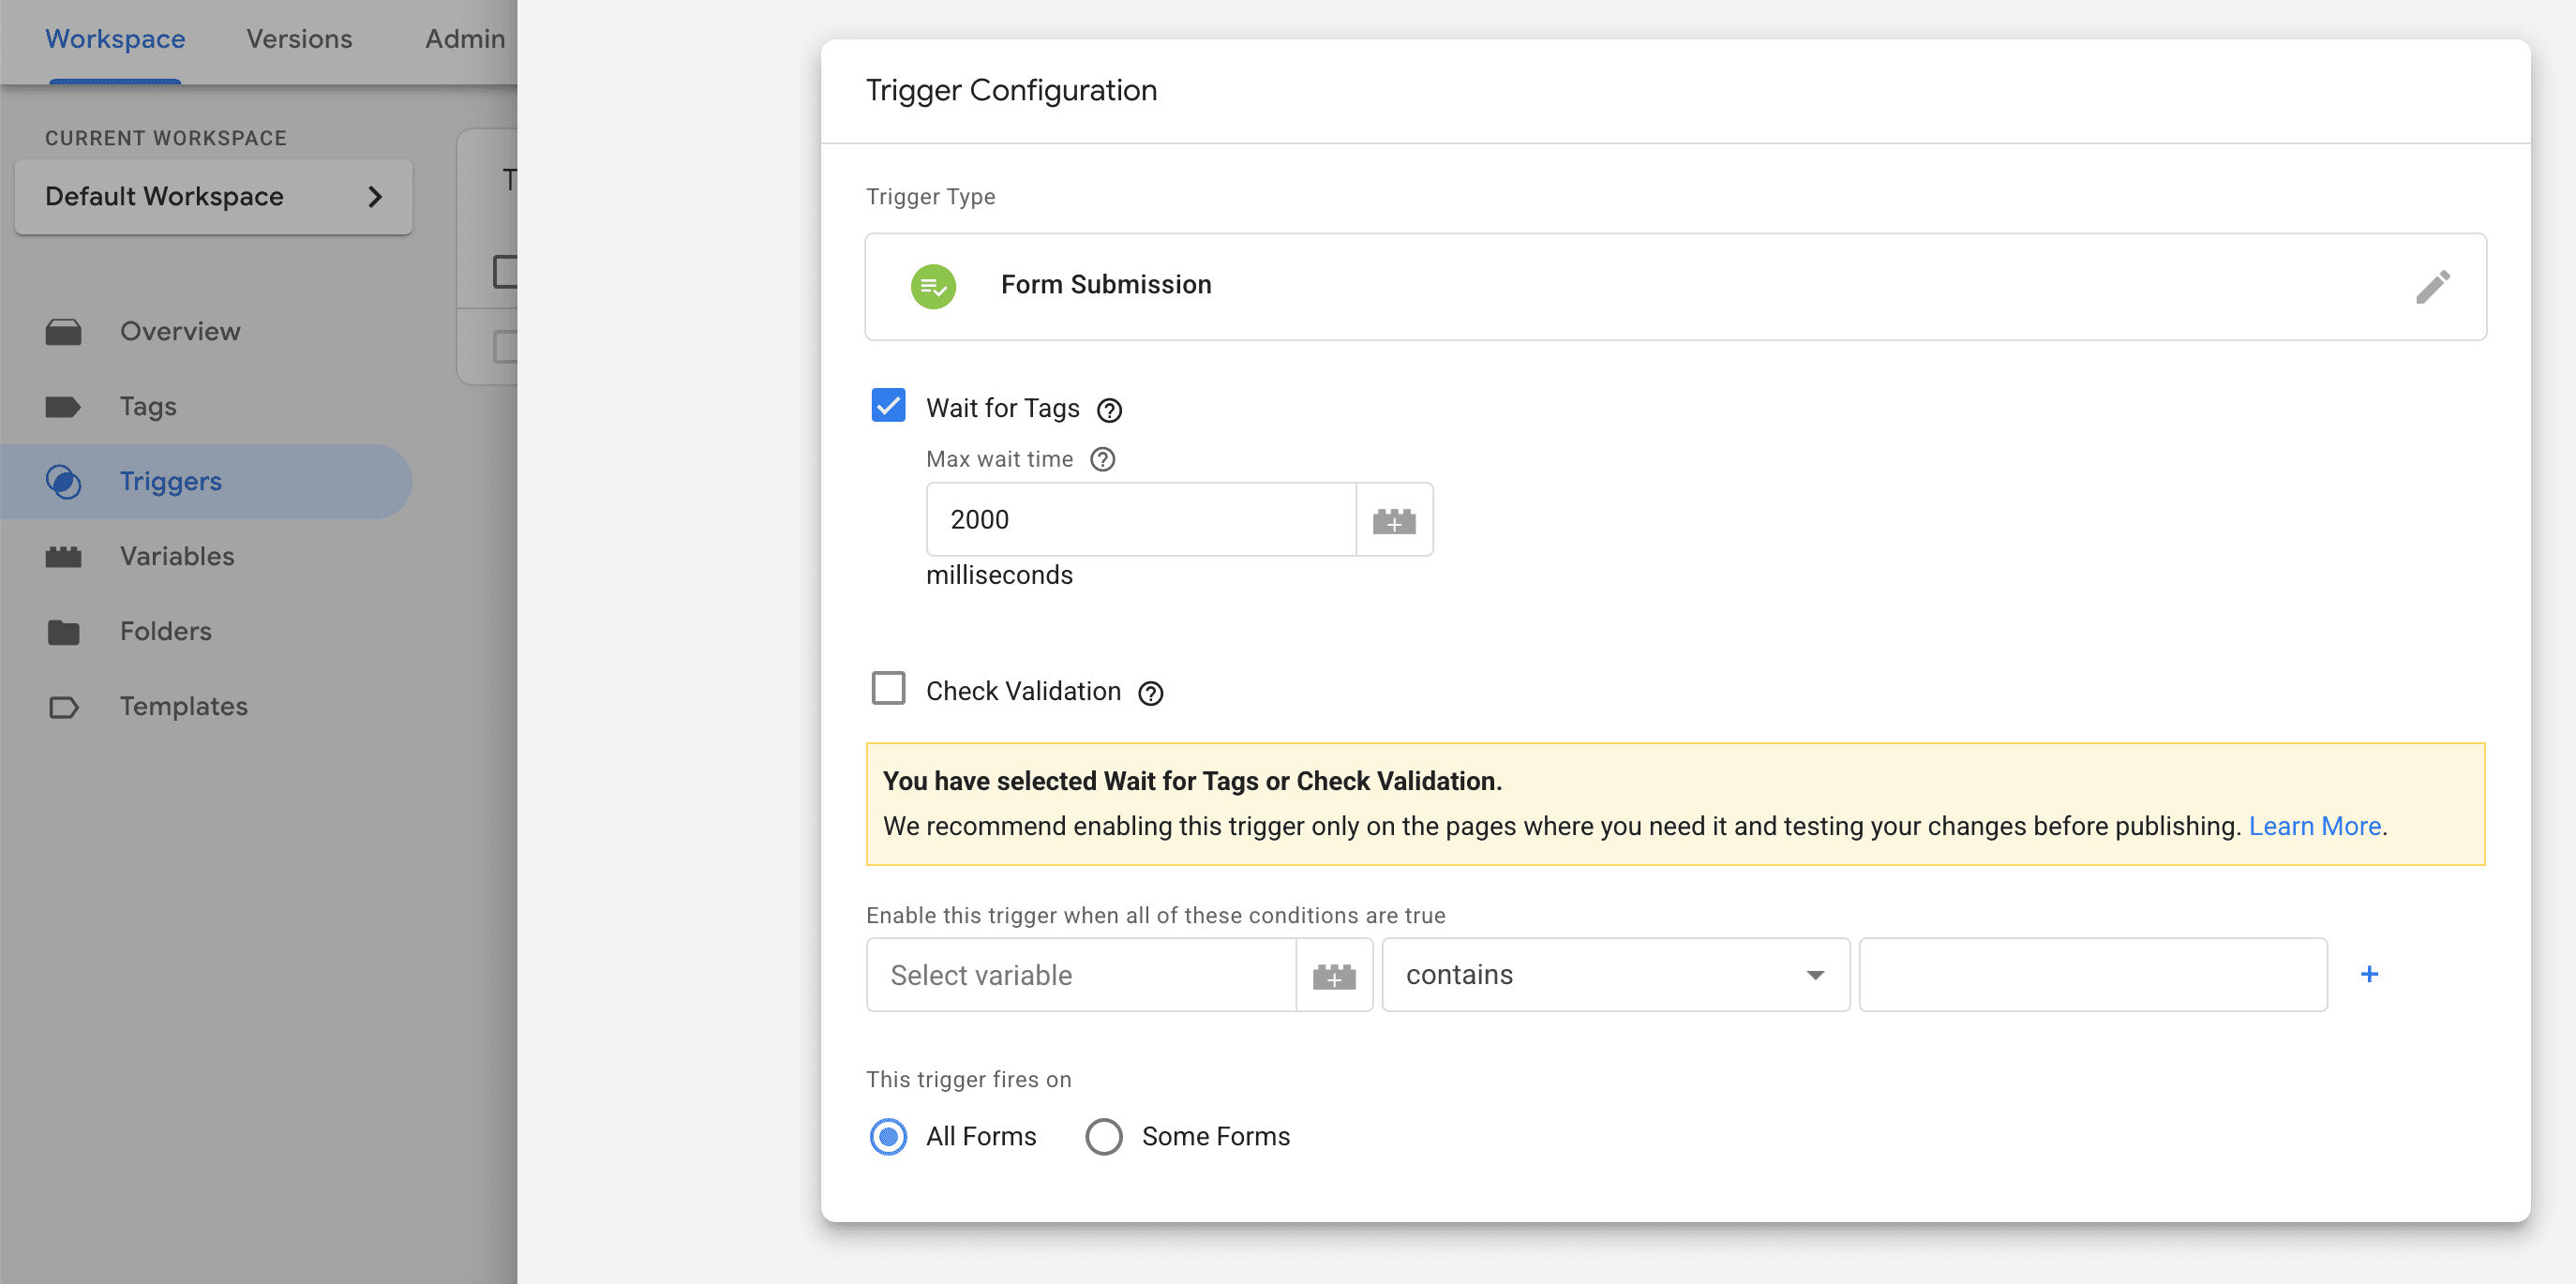
Choose Form Submission
Set "This trigger fires on: All Forms"
(If you only want specific forms, use "Some Forms" and add conditions like Form ID or Form Classes)
CRITICAL: Check the box "Wait for Tags" → Set max wait time to 2000 milliseconds
(This prevents the page from redirecting before the event fires)
Check "Enable this trigger when all of these conditions are true" → Leave default (Page URL contains http)
Name it: "Form - All Submissions"
Click Save
Go to Variables → Configure → Under Forms, check:
Form ID
Form Classes
Form Target
Form Text
Go to Tags → New
Choose Google Analytics: GA4 Event
Paste your Measurement ID
Event Name: form_submit
Add Event Parameters:
Parameter Name: form_id → Value: {{Form ID}}
Parameter Name: form_classes → Value: {{Form Classes}}
Parameter Name: form_destination → Value: {{Form Target}}
Triggering: Select "Form - All Submissions"
Name: "GA4 - Form Submissions"
Click Save
Checkpoint: Preview. Submit a form on your site (even if it's fake data). Check if "form_submit" fires before the page redirects.
Event 3: Outbound Link Clicks (Scraping Method)
Why this matters: When users click links leaving your site, you're learning about their intent and next steps.
Click Triggers → New
Choose Click - All Elements
Set "This trigger fires on: Some Clicks"
Add conditions (use AND logic):
Click URL → does not contain → your own domain (e.g., "yourbrand.com")
Click URL → matches RegEx → ^https?://.*
(This ensures it's an actual external link, not mailto: or tel: links)
Name it: "Click - Outbound Links"
Click Save
Go to Tags → New
Choose Google Analytics: GA4 Event
Paste your Measurement ID
Event Name: click_outbound
Add Event Parameters:
Parameter Name: link_url → Value: {{Click URL}}
Parameter Name: link_text → Value: {{Click Text}}
Parameter Name: link_domain → Value: Use a Custom JavaScript variable (optional, or skip)
Triggering: Select "Click - Outbound Links"
Name: "GA4 - Outbound Clicks"
Click Save
Checkpoint: Preview. Click any external link. Check if "click_outbound" fires with the destination URL captured.
MODULE 7: Publish Your Events
Time: 1 minute
Click Submit → Name it "Added Button, Form, and Outbound Events"
Add description: "Tracking user interactions via element scraping: buttons, form submissions, external links"
Click Publish
Checkpoint: Go to GA4 → Reports → Realtime → Look at the Event count by Event name card. Within a few minutes of activity, you should see button_click, form_submit, and click_outbound events appearing.
MODULE 8: Build Your First Looker Studio Report
Time: 12 minutes
You've got data flowing. Now let's turn it into insights your team can actually use.
📊 About Looker Studio Data Connections
Looker Studio is a data visualisation powerhouse that can connect to dozens of data sources:
Native Google Connectors (seamless, no setup):
Google Analytics 4 (what we're using today)
BigQuery (the real power move for advanced analytics)
Google Ads
Google Sheets
Search Console
YouTube Analytics
Third-Party Connectors (via partner tools or APIs):
Facebook Ads, LinkedIn Ads, TikTok Ads
MySQL, PostgreSQL, SQL Server databases
Salesforce, HubSpot, Shopify
CSV upload, Google Cloud Storage
Why this matters: Today we're connecting directly to GA4 for speed and simplicity. But as you scale, you'll likely export GA4 data to BigQuery (Google's data warehouse) for:
Unlimited data retention (GA4 only keeps 14 months)
Custom SQL queries and complex analysis
Blending data from multiple sources (ads + CRM + analytics)
Raw, unsampled data for enterprise reporting
For this guide: I am using the GA4 direct connector—zero setup, real-time data, perfect for getting started. Just know that BigQuery is waiting when you're ready to level up.
Step 1: Connect GA4 to Looker Studio
Go to lookerstudio.google.com
Click Create → Report
In the "Add data to report" panel, search for Google Analytics
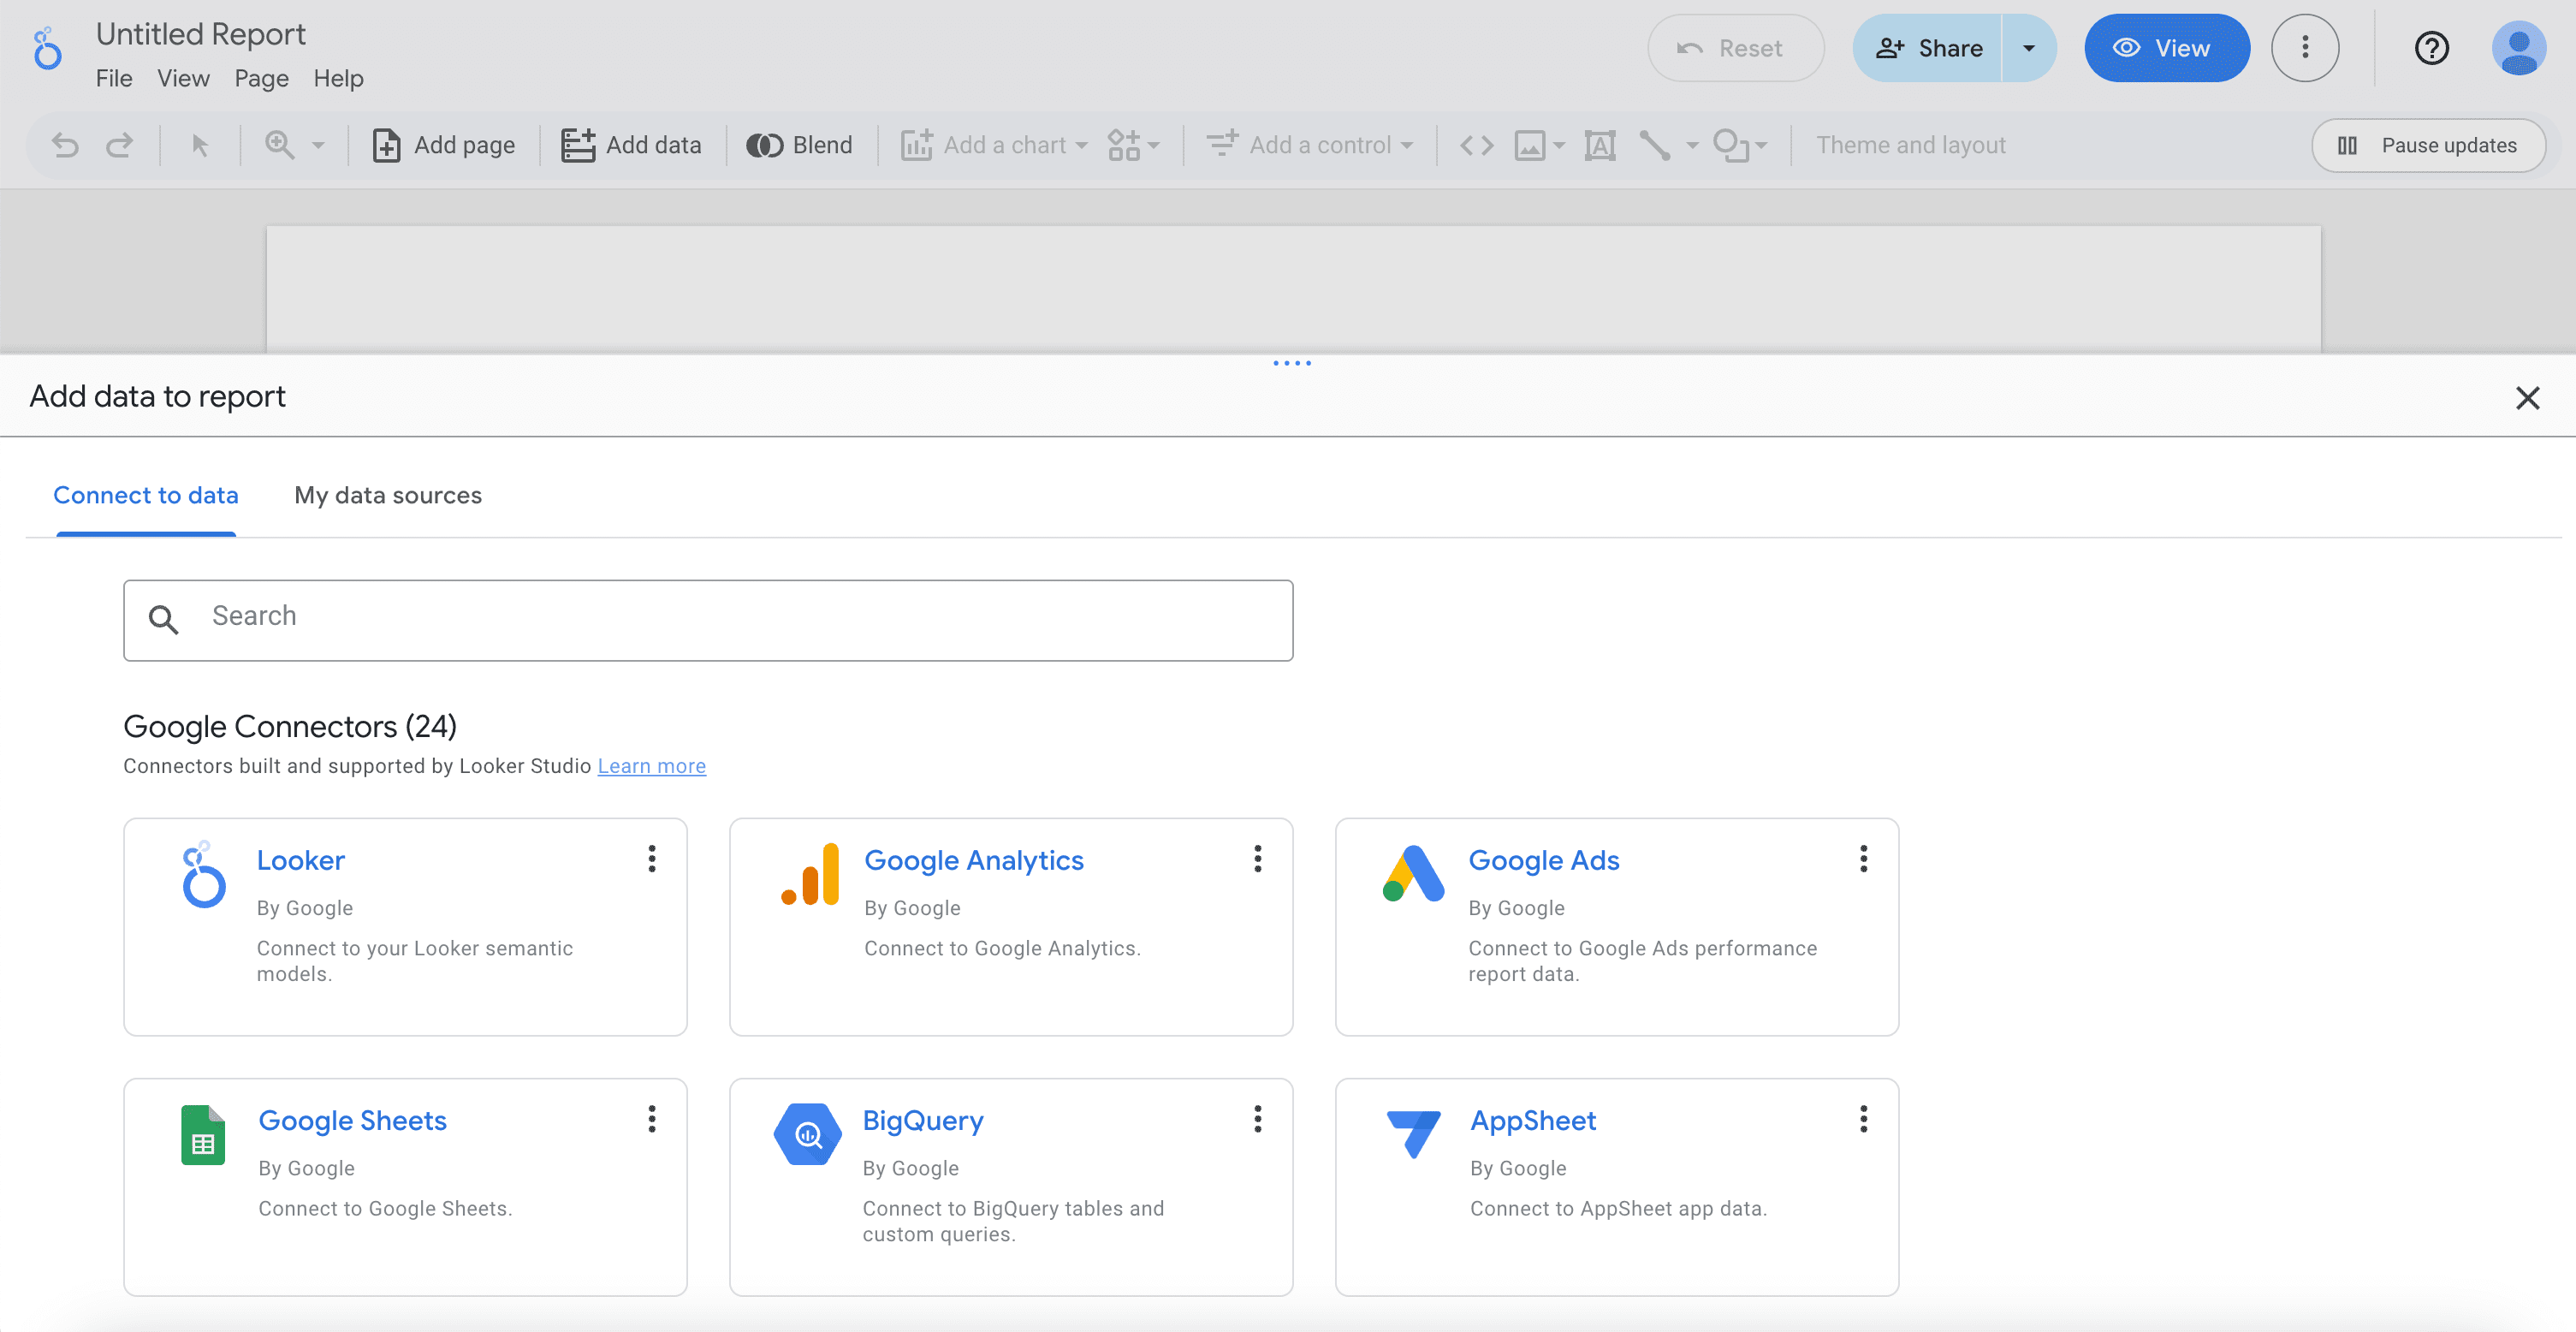
Select your GA4 property from the list
Click Add → Click Add to Report
Checkpoint: You should see a blank canvas with a default table showing some GA4 data.
What just happened: Looker Studio is now querying your GA4 property directly. Every time someone opens this report, it fetches fresh data. No exports, no manual updates.
Step 2: Build a "Most Popular Pages" Report
What you're building: A table showing which pages get the most traffic.
Delete the default table (select it → press Delete)
Click Add a chart (top toolbar) → Choose Table
Draw the table on your canvas
In the Data panel (right side):
Dimension: Change to Page path and screen class (or just Page path)
Metric 1: Views (or Active users or Sessions)
Metric 2: Add another metric → Average engagement time
Click Style tab:
Enable Row numbers
Set Rows per page to 10
Sort by Views (descending)
Checkpoint: You should see a table with your top-performing pages by traffic volume.
Step 3: Build a "Button Clicks" Report
What you're building: See which buttons are getting clicked the most.
Click Add a chart → Table
In the Data panel:
Dimension: Event name
Add a Filter: Event name = button_click
Click Add a dimension → Type button_text in the search (this is the custom parameter you sent)
If it doesn't appear, click Add a field (bottom right) → Create field:
Field name: Button Text
Formula: Event parameter value (button_text)
Click Save → Click Done
Now set:
Dimension: Button Text (your new custom field)
Metric: Event count
Sort by Event count (descending)
Checkpoint: You should see which button texts got clicked most (e.g., "Sign Up", "Learn More", "Download").
Step 4: Build an "Outbound Clicks" Report
What you're building: Track where users are going when they leave your site.
Click Add a chart → Table
In the Data panel:
Dimension: Event name
Add a Filter: Event name = click_outbound
Click Add a field → Create field:
Field name: Outbound Link URL
Formula: Event parameter value (link_url)
Click Save → Click Done
Set:
Dimension: Outbound Link URL
Metric: Event count
Sort by Event count (descending)
Checkpoint: You should see which external domains/URLs your users are clicking to (partner sites, social media, resources, etc.).
Step 5: Add a Date Range Control
Why: So you and stakeholders can filter the entire report by time period.
Click Add a control (top toolbar) → Date range control
Place it at the top of your report
Click Style → Choose a layout you like
Checkpoint: Click the date range selector—all your charts should update based on the selected period.
Step 6: Polish and Share
Click the report title (top left, says "Untitled Report") → Rename it: "Website Performance Dashboard"
Click View (top right) to see the final report as your stakeholders will see it
Click Share (top right) → Add email addresses of team members OR get a shareable link
Set permissions: Viewer (they can see, not edit) or Editor (they can modify)
Checkpoint: Open the shared link in an incognito window. Your report should load with live data.
🎓 WHAT YOU'VE ACCOMPLISHED
Your Analytics Stack is Now Live:
✅ Created a GA4 property from scratch
✅ Installed Google Tag Manager on your website
✅ Connected GA4 to GTM (no more hardcoded tracking snippets)
✅ Set up page view tracking for both traditional and SPA sites
✅ Configured button click tracking (know which CTAs work)
✅ Built form submission tracking (capture lead gen signals)
✅ Added outbound link tracking (understand user intent beyond your site)
✅ Understood the Data Layer vs. scraping trade-offs
✅ Tested everything before going live (like a pro)
✅ Published a production-ready GTM container
✅ Connected GA4 directly to Looker Studio
✅ Built 3 actionable reports: top pages, button performance, outbound traffic
Good luck and if you need support feel free to rich me out on https://www.linkedin.com/in/ilya-semenov-al/ or https://www.ilya-semenov.com/contact